
• Skip to primary navigation
  • Skip to main content
Power Brake - Diamond Technology Solutions

727-289-9000

  • Home
  • Technology
    • Description
    • Test Results
  • Components we Offer
    • Drums
    • Rotors
    • Other Components
  • Brake Safety
  • How You Save
    • Save with Power Brake’s Diamond Technology
    • ROI
    • Case Studies
  • Applications
    • Fire Trucks
    • Ambulances
    • Police Vehicles
    • Rescue Trucks
    • Cement Trucks
    • Refuse Trucks
    • Transit and Paratransit
    • Shuttles
    • Vac Trucks
    • Towing & Recovery
    • Tankers
  • Company
    • About
    • Certifications and References
    • News
    • Try and Buy Program
  • Contact
Test Results
You are here: Home / Technology / Test Results

Test Results

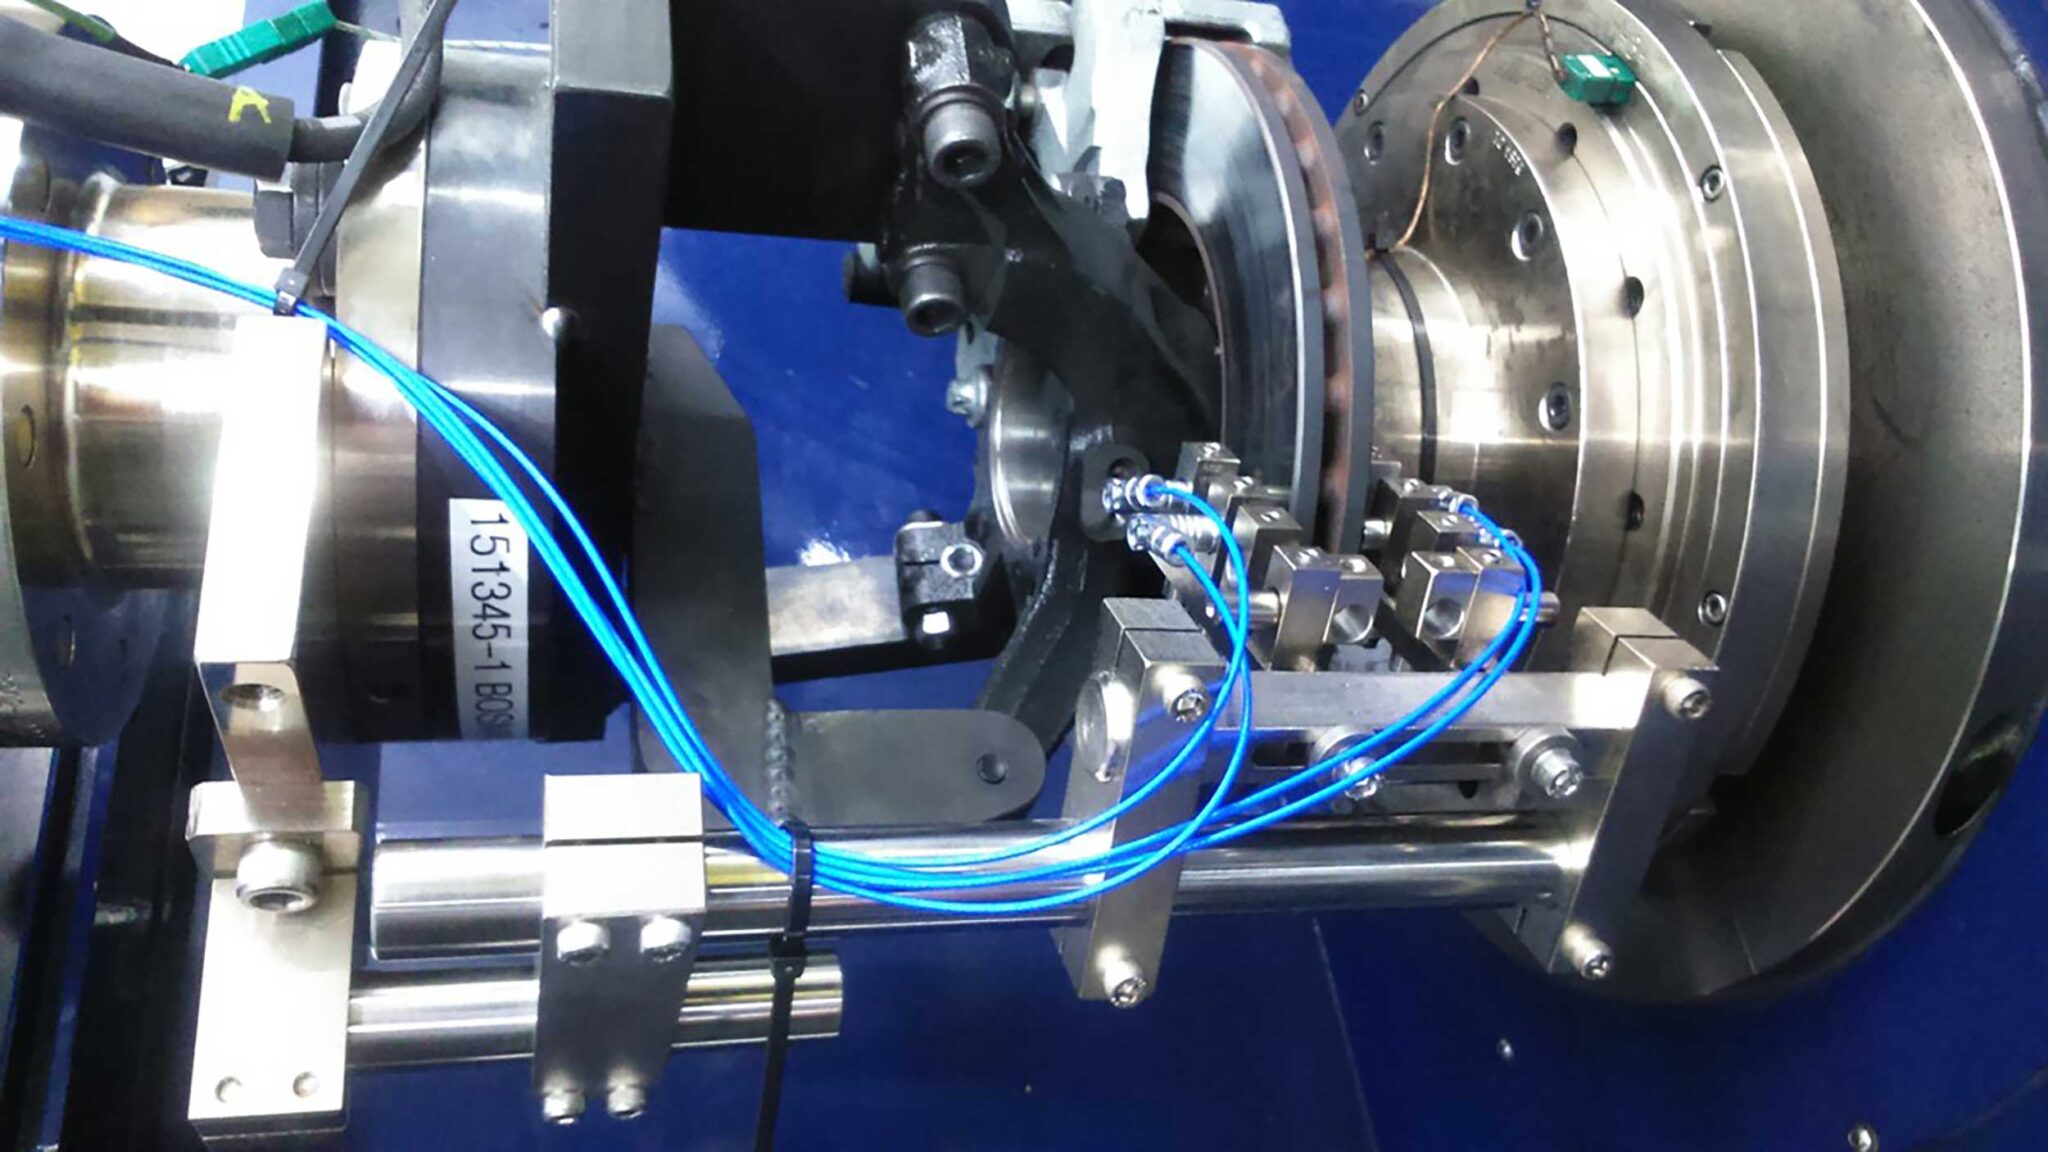
Power Brake’s Diamond Technology was tested by Greening Testing Laboratories, Inc. according to SAE J2115.

Power Brake has met the requirements of the Federal Motor Vehicle Safety Standards (FMVSS) 121 –  Section 6 SAE J2115.

Section 7 covers Wear & Effectiveness at Temperature Version. This test is conducted to confirm wear rates and brake effectiveness of the disc rotor and the brake pads friction coupler at 5 different temperature cycles.

5,265 cycles were conducted, with a maximum temperature of 1,222 F that was reached during the 5th cycle. The results were impressive; Most rotors and pads wear out completely, but our rotors wore less than 1mm and the pads only wore about halfway.

Brake Pad Wear Rate AverageThickness Loss – 0.649”
Mass Loss Kg – 0.950 Kg.
Brake Disc Rotor Wear Rate AverageThickness Loss – 0.0021”
Mass Loss Kg – 0.035 Kg.
Post Visual Inspection of Brake PadsNo Flaking
Light Glazing
Light Grooving
Light Pitting
Light Resin Bleed
No Cracking
Post Visual Inspection of Brake Disc RotorNo Heat Checking
No Hot Spots
Light Grooving
No Cracking
Light Lining Transfer
Brown, Grey in Color
Surface Finish of Brake Disc Rotor42 Ra Start
98 Ra Finish
TIR (total indicated runout) 0.002”
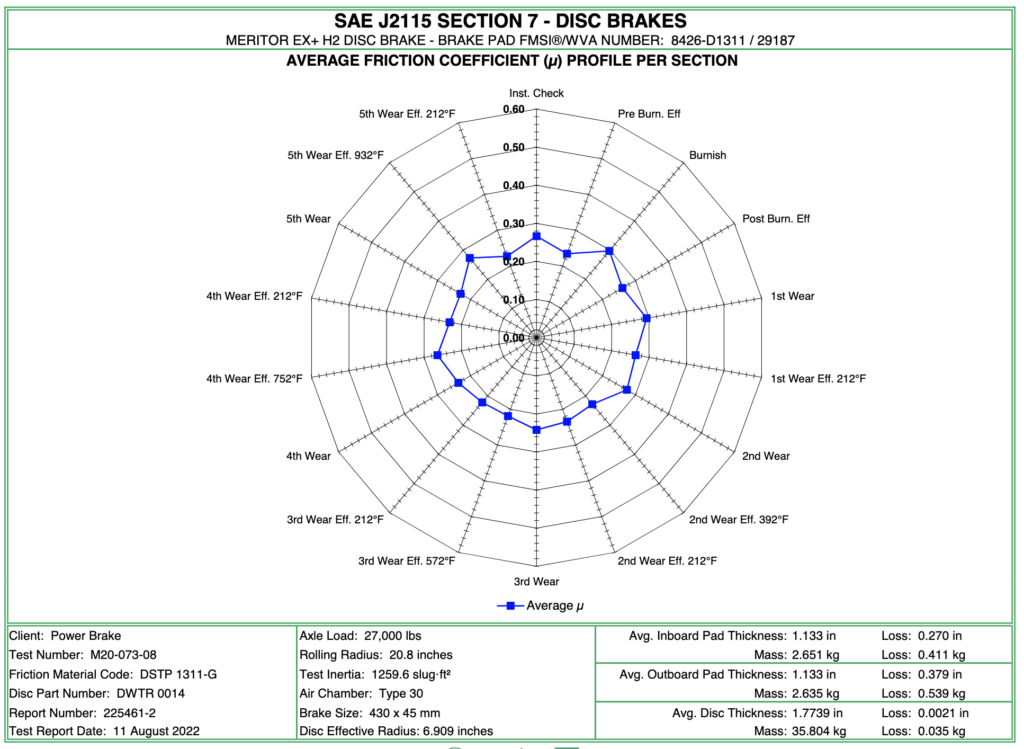
Brake Friction Coefficient Frequenc0.20 Stage – Post Burnish was 2.5%
0.32 Stage – 100% From Post Burnish through Completion – No Frequency in Friction

The graph below shows the stability of the coefficient of friction throughout the entire test, hot or cold braking

Power  Brake - Diamond Technology brake components

(727) 289-9000

2985 44th Ave. North | St. Petersburg, FL 33714
Fax (727) 528-7995

Learn How You Can Save

Contact us for a consultation to learn what Power Brake can do for your fleet. Ask about our Try and Buy Program!

Try and Buy
Start Over
  • Warranty
  • Privacy Policy

© 2015-2026, All rights reserved

Site by Industrial Webworks

MENU
  • Home
  • Technology
    • Description
    • Test Results
  • Components we Offer
    • Drums
    • Rotors
    • Other Components
  • Brake Safety
  • How You Save
    • Save with Power Brake’s Diamond Technology
    • ROI
    • Case Studies
  • Applications
    • Fire Trucks
    • Ambulances
    • Police Vehicles
    • Rescue Trucks
    • Cement Trucks
    • Refuse Trucks
    • Transit and Paratransit
    • Shuttles
    • Vac Trucks
    • Towing & Recovery
    • Tankers
  • Company
    • About
    • Certifications and References
    • News
    • Try and Buy Program
  • Contact

Federal Stopping Distance Regulations Chart

How well your vehicle must stop is not a matter of opinion. In fact, it is clearly defined in D.O.T. Code of Federal Regulations. Download your FREE Guide and Stopping Distance Chart. JUST TELL US WHERE TO SEND IT!

Subscribe

* indicates required

/* real people should not fill this in and expect good things – do not remove this or risk form bot signups */